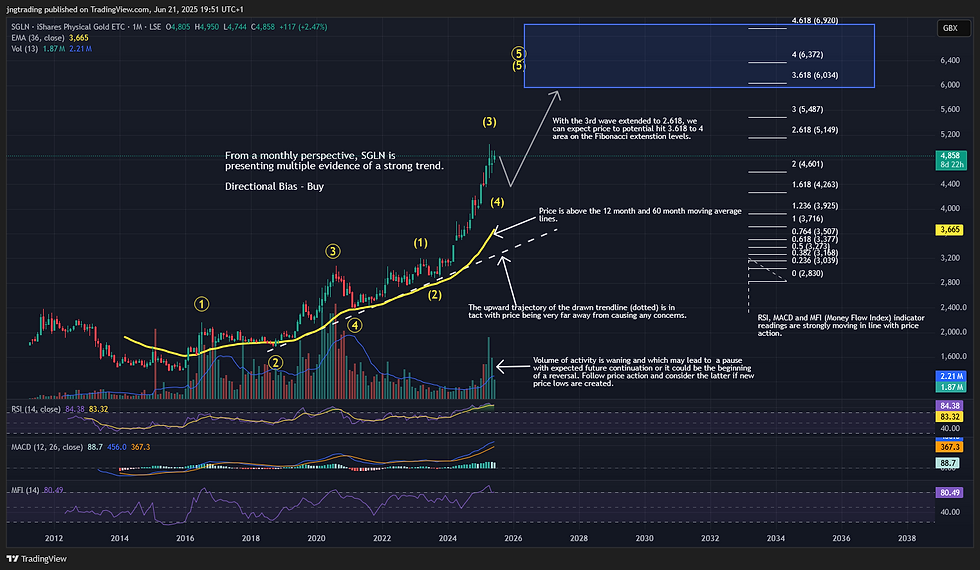
SGLN (iShares Physical Gold ETN) – Is it too late to profit from Gold? – Patience could be the key to success – Trends x Waves Weekly – 22nd June 2025
- John Nwatu MSTA CFTe
- Jun 22, 2025
- 3 min read
Updated: Oct 22, 2025
Executive Summary
Gold remains a sought-after safe haven amid rising inflation, currency devaluation, and economic uncertainty. The iShares Physical Gold ETC (SGLN) provides retail investors with an accessible way to hedge against these risks by tracking physical gold. While long-term trends are bullish and gold's value as a store of wealth is reinforced, technical charts suggest a short-term pause or correction; investors may benefit from patience and waiting for clear technical confirmation before making new entries.
About SGLN
SGLN (iShares Physical Gold ETC) is an exchange-traded commodity that offers investors exposure to the price of gold by holding physical allocated gold bars in secured vaults.; essentially you get to invest in gold without purchasing it physically. It is designed to closely track the performance of the gold spot price minus the annual fee.
Over the past few years, the persistent increase in inflation, aggressive monetary expansion (governments printing and borrowing more money), and the weakening of major fiat currencies—The British Pound, US Dollar and the Euro—have intensified concerns over purchasing power erosion. We’ve all experienced and witnessed the cost of everyday goods and services increasing every year. Central banks and private investors alike have increasingly turned to gold as a hedge against inflation and systemic risk. This surge in demand reflects a broader move toward hard assets amidst a backdrop of fiscal deficits, geopolitical instability, and doubts about long-term currency stability, reinforcing gold's appeal as a store of value.
Although having some cash is important, if you want to preserve the value of your financial holdings one must consider getting exposure in alternative assets that are not depreciating in value as we’ve seen consistently happen with currencies.
Chart Breakdown & Technical Insights

Gold has been on a very strong run and based on the trend we’re seeing on the monthly chart remains the same with the expectation that price will continue to go up. All technical trend and momentum indicators are not showing any signals of weakness. Volume has however slowed in June indicating that we may have just finished the 3rd wave and are due a correction before resuming the upward trend.

When we zoom in to the weekly chart, the picture does become a bit more cautious. Price appears to be consolidating or correcting slightly — potentially working through a short-term pause before the next move higher. This chart suggests it might be worth waiting for clearer confirmation that support is holding before jumping in. The expectation is for price to test the lower end of the highlighted channel before resuming the trend. If price breaks through and closes above the upper channel at 4,950 this could be an opportunity to make an aggressive entry or wait for price to close above 5,055 for clearer confirmation and a more conservative buy entry. Price reversing and closing below 4,580 after entry is made invalidates this trade idea.
Tactical Strategy & Trade Setup
Trade Component | Details |
🎯 Setup Type | Continuation |
📅Entry Zone | 4,950 and 5,055 |
⛔ Invalidation | 4,580 – could change depending on price action prior to entry. |
🪙 Take Profit Targets | TP1 – 5,500/ TP2 – 6,000 - These are 3 and 3.618 levels of Fibonacci Extension |
🎁 Risk Reward | 4,950 entry – 1.5 / 2.8 | 5,055 entry – 0.9 / 2 |
🎁Risk Reward Example | $1,000 on risk potentially makes between $900 and $2,800 in profit. Depending on entry and exit points |
Like the insight?
📩 Subscribe to Trends x Waves Weekly for balanced actionable ETF and asset insights delivered straight to your inbox.
💬 Drop your thoughts or charts in the comments. I reply to every thoughtful message.
Previous Analysis
Week | Asset | Setup | Outcome | Previous Post |
April 29 | SIL | Continuation | Target Hit |


Comments