
How Far Can The FTSE 100 Bull Run Go?
- John Nwatu MSTA CFTe
- Feb 2, 2025
- 2 min read
Updated: Oct 22, 2025
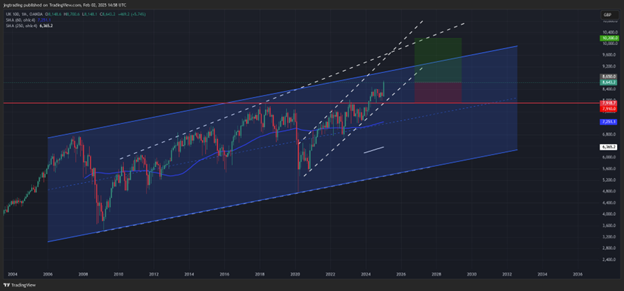
The FTSE 100 recently retested previous all time highs (ATH) and looks set to continue on its bull run. The analysis presents 2 potential price action routes which indicates that price could hit £9,000 and reverse or if backed with sound fundamentals we could see price extending out to £10,000. The below outlines the findings and evidence from the chart analysis.
Chart Analysis
Trend
All trendlines and channels look bullish for the FTSE 100 with price is also well above the 60 month moving average line. Additionally, previous major resistance at 7,900 is now acting as support for the index, providing further evidence to expect higher future prices.
Price Action / Chart Patterns
Based on Elliot Wave analysis the phase of the trend is looking mature with 2 possible routes for price action. One route takes the assumption that the current bull wave we’ve been on will extend potentially targeting Fibonacci number target of 2.618 (£10,000).

The other route, although not preferred is still a possibility. It indicates that this last wave is the final bull run with a major correction expected when price hits around £9,000. This coincides with the expected Fibonacci extension target of 2 (£9,000) and the upper barrier of the trend channel which if respected by traders and investors could result in a reversal. Additionally, RSI shows a divergence which is typically bearish but to be viewed as a warning signal to be cautious of buying and not confirmation for a reversal.

Summary
• Currently bullish on the FTSE100 on the basis of the above evidence of a bull trend in place.
• With previous ATH now acting as support, price is expected to continue to the upside.
• Price retracement below 7910 (the ATH support level) would indicate that the breakout out has been rejected with a potential major reversal to commence.


Comments