
ARKW (Ark Next Gen Internet ETF) Chart Review – 10th May 2025
- John Nwatu MSTA CFTe
- May 12, 2025
- 2 min read
Updated: Oct 22, 2025
Weekly Chart
The ARKW ETF chart is looking bullish from a technical analysis perspective. Price is above all EMA lines (50, 100, 200 and 250 weeks) and backed with a consistent trendline which is acting as a reliable support. Price recently bounced from the 200 and 250 week EMA lines which also coincided with the 50% retracement of the identified Elliot Wave 5 wave impulse which is considered to be extremely bullish likely to lead to further upside. Based on the present information the recommended strategy will be to position for buy trades and target 2 main levels; 210 – 225 and 250 - 260. These targets are in line with 1 and 1.236 Fibonacci extension levels of the previous wave which topped out at around 190 (wave A). The bullish view will change if price closes below 78.62 (the bounce from the 250 EMA line).

Daily Chart
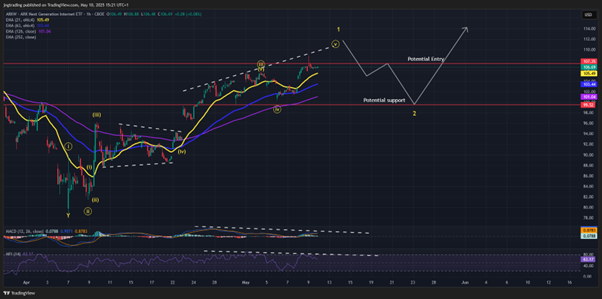
Following on from the bullish evidence identified in the weekly chart, the same is seen on the daily chart although it seems like price is likely to pull back at this point before rallying for the big move up to 225. Looking at the wave structure it looks like the first 5 waves of the 1st wave of the 3rd wave is not completed yet as there are MACD and Money Flow Index divergences which indicates both trend strength and volume will temporarily reverse with the expectation for price to pick up at around 99 level. If price does pick up at this point with increased momentum and the divergences are invalidated, this potentially nullifies the pullback expectation and could mean there is an extension to the trend which a buy trade could be considered.

1 Hour Chart
The 1 hour chart presents a clearer picture of the waning wave in the lower timeframe. The chart also shows the divergences on the MACD and Money Flow Index indicators. Although bullish bias is also maintained on this chart, the recommended strategy will be to wait for the potential retrace ahead which will likely see prices come down to previous support levels of 99.50 with a view to enter a buy trade if the coming downtrend is broken. Assuming entry is made at 107.35 and support at 99.50 with take profit target at 190 or 225 the Risk Reward ratio expected is 10.5 and 15.


Comments