
Weekly Market Review — 5th May 2026: Tech Bullish, Dollar and Euro Weakening, EURNOK and USDCAD in Focus
Rating: Cautiously Risk-On | Bias: Trend and Momentum Led
The Big Picture
This week's technical picture tells a fairly clear story. The dollar and euro are both showing signs of weakness on the charts, whilst tech stocks continue to attract buying interest. The main setups in focus are two oil-linked currency pairs — EURNOK and USDCAD — where the trend and momentum structure look compelling. The Nasdaq 100 is also on the radar, though not yet offering a clean entry.
One macro risk worth keeping front of mind: any positive developments around the Strait of Hormuz or a shift in Iran ceasefire talks could put downward pressure on oil prices, which would directly affect the NOK and CAD positions. The trades are technically strong, but this external risk cannot be ignored.
EURNOK — Short
The euro has been weakening against the Norwegian krone, and the technical structure supports further downside. The Elliott Wave count on the daily chart is well-developed — price has completed waves i through iii of a larger impulse, with the current wave iv corrective bounce potentially nearing completion around the 10.96 area. The projection targets wave v lower, with Fibonacci extension levels pointing toward the 10.10–10.30 range as the next meaningful support zone.
The RSI sits in oversold territory near 29–31, and the MACD remains in negative territory — both consistent with a market in a sustained downtrend. The signal here is to wait for the current wave iv bounce to complete before looking to enter short on the resumption of wave v. Price may need to pull back further before a clean entry presents itself.
The NOK benefits directly from elevated oil prices. As long as energy markets remain tight, this trade has a sound fundamental backdrop to lean against as well. The setup is clean; the primary risk is an oil price reversal driven by geopolitical de-escalation.
Bias: Short · Elliott Wave impulse in progress · Wait for wave iv completion before entry · Monitor oil closely

USDCAD — Short
USDCAD is developing a similar picture. The daily chart shows what appears to be a completed five-wave impulse to the upside from the 2023 lows, with the high of 1.4791 now forming the peak of that move. Price has since broken down in what the wave count labels as a corrective ABC structure — wave (a) complete, wave (b) a corrective bounce, and wave (c) now under way to the downside.
The projected target for wave (c) sits in the 1.26–1.29 range, near the 1.0 to 1.236 Fibonacci extension zone. A pullback — potentially an alt wave b — is anticipated before continuation lower, and that pullback offers the preferred entry point.
Dollar weakness is the dominant theme, and CAD draws additional support from its direct correlation with oil prices. Both forces are aligned in favour of this trade. The structure is strong; the plan is to wait for the corrective bounce to exhaust before committing.
Bias: Short · Dollar weakness and oil correlation aligned · Anticipating corrective pullback then continuation lower toward 1.26–1.29

Nasdaq 100 — Watching, Not Entering
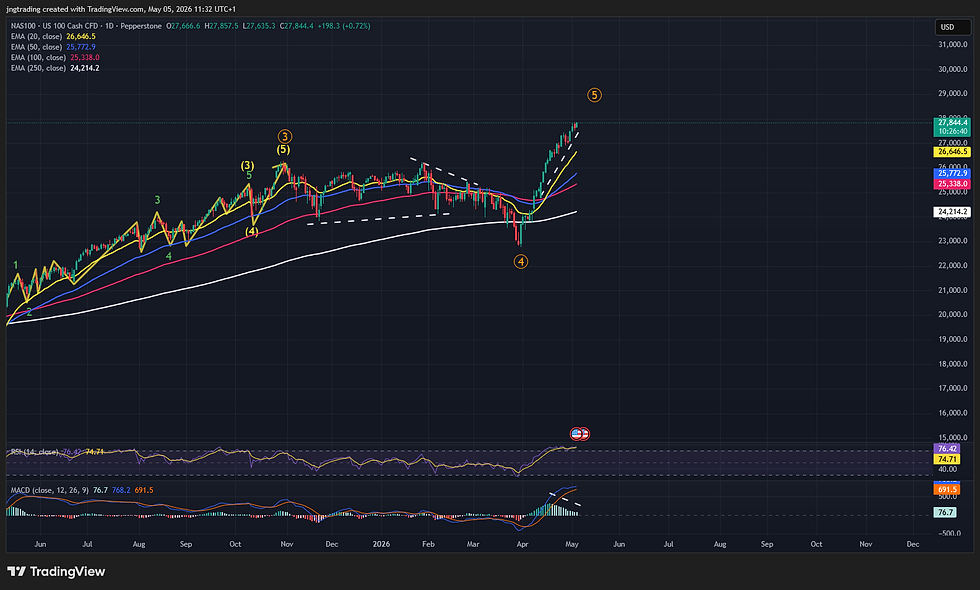
The broader trend in tech remains bullish and the Elliott Wave structure supports that view. The daily chart shows a well-defined five-wave impulse from the 2025 lows, with waves 1 through 4 clearly labelled and price now trading in what appears to be wave 5 — pushing toward new highs above 27,800.
However, momentum is beginning to show signs of fatigue that warrant caution. The MACD, whilst still positive, is decelerating — an early warning that the buying pressure driving this move may be losing conviction. More notably, there is potential RSI divergence developing: price is making a higher high whilst the RSI is failing to follow, printing a lower reading than the previous peak. When these two signals appear together at the top of a fifth wave, they tend to precede a corrective pullback rather than a continuation.
This does not mean the trend is over. There is likely room for modest further upside, but the risk-to-reward of entering now is unfavourable. The more prudent approach is to step back, allow the momentum indicators to reset through a corrective pullback, and reassess from a lower entry level with a cleaner technical picture.
Bias: Bullish · No new entries at current levels · Waiting for wave 5 completion, RSI reset and corrective pullback
What to Watch This Week
Iran and Strait of Hormuz developments — the primary external risk to both the EURNOK and USDCAD setups. Any de-escalation in the energy supply story puts these trades in jeopardy.
Oil price direction — a sustained move lower weakens the NOK and CAD, undermining both currency trade setups.
Nasdaq 100 pullback — a controlled retracement with RSI reset would present a far more attractive entry point for long positions in tech.
Dollar broadly — continued weakness supports the short USD theme in USDCAD and the risk-on environment across the board.
USDCAD corrective bounce depth — the pullback level will determine the preferred entry point for the short.
Nothing written here constitutes financial advice. All analysis is based on technical observations at the time of writing and is subject to change as market conditions develop.



Comments